Methods of Research
1. Experimental Research
Experimental research is a blueprint of the procedure that enables the researcher to maintain control over all factors that may affect the result of an experiment. In doing this, the researcher attempts to determine or predict what may occur. Therefore, experimental research is any research conducted with a scientific approach, where a set of variables are kept constant while the other set of variables are being measured as the subject of experiment. In experimental research, the relationship between two or more variables is tested by performing experiments involving manipulation of stimuli, environment, or an independent variable. The relationship between dependent and independent variables is tested under controlled settings. Experimental research is commonly used in sciences such as sociology and psychology, physics, chemistry, biology and medicine etc.
It is often used where there is time priority in a casual relationship, there is consistency in a casual relationship and the magnitude of the correlation is great.
Example
To investigate the effects of a new drug abuse prevention program on the attitudes of high school students using experimental and control groups who are either exposed of not exposed to the program, respectively and using a pretest-posttest design in which only half of the students randomly receive the pretest to determine how much of an attitude change can be attributed to pretesting or to the educational program.
Definition
According to Santa Palella and Feliberto Martins (authors of the book “Methodology of quantitative research”)
Experimental research is the experiment in which the researcher manipulates an experimental variable not proven.
According to these researchers, the conditions must be strictly controlled, in order to describe in what way and for what cause a phenomenon is produced or can occur.
According to Phidias Arias (author of the book “The Research Project”)
Experimental research is a process that involves subjecting an object or group of individuals under certain conditions, stimuli or treatment (independent variable), to observe the effects or reactions that occur (dependent variable)”.
According to Douglas Montgomery
Experiment research is an experiment in which one or more variables are deliberately manipulated.
Professor R.A. Fisher’s name is associated with experimental designs. Beginning of such designs was made by him when he was working at Rothamsted Experimental Station (Centre for Agricultural Research in England). As such the study of experimental designs has its origin in agricultural research. Professor Fisher found that by dividing agricultural fields or plots into different blocks and then by conducting experiments in each of these blocks, whatever information is collected and inferences drawn from them, happens to be more reliable. This fact inspired him to develop certain experimental designs for testing hypotheses concerning scientific investigations. Today, the experimental designs are being used in researches relating to phenomena of several disciplines.
Characteristics/Features of Experimental Research
- There must be two groups. One in which the factors and variables are not modified and in which the manipulation is carried out.
- The researcher intervenes by modifying variables or factors that affect the experiment and observes the reactions that are generated.
- With two equivalent groups, the application of the experiment is established in a random way, in order to be able to make the valid relationships from the experimental data.
Basic Principles of Experimental Research Design
Professor Fisher has enumerated three principles of experimental designs:
- Principle of Replication;
- Principle of Randomization; and the
- Principle of Local Control.
1. Principle of Replication
According to the Principle of Replication, the experiment should be repeated more than once. Thus, each treatment is applied in many experimental units instead of one. By doing so the statistical accuracy of the experiments is increased. For example, suppose we are to examine the effect of two varieties of rice. For this purpose we may divide the field into two parts and grow one variety in one part and the other variety in the other part. We can then compare the yield of the two parts and draw conclusion on that basis. But if we are to apply the principle of replication to this experiment, then we first divide the field into several parts, grow one variety in half of these parts and the other variety in the remaining parts. We can then collect the data of yield of the two varieties and draw conclusion by comparing the same. The result so obtained will be more reliable in comparison to the conclusion we draw without applying the principle of replication. The entire experiment can even be repeated several times for better results. Conceptually replication does not present any difficulty, but computationally it does. For example, if an experiment requiring a two-way analysis of variance is replicated, it will then require a three-way analysis of variance since replication itself may be a source of variation in the data. However, it should be remembered that replication is introduced in order to increase the precision of a study; that is to say, to increase the accuracy with which the main effects and interactions can be estimated.
2. Principle of Randomization
The Principle of Randomization provides protection, when we conduct an experiment, against the effect of extraneous factors by randomization. In other words, this principle indicates that we should design or plan the experiment in such a way that the variations caused by extraneous factors can all be combined under the general heading of “chance.” For instance, if we grow one variety of rice, say, in the first half of the parts of a field and the other variety is grown in the other half, then it is just possible that the soil fertility may be different in the first half in comparison to the other half. If this is so, our results would not be realistic. In such a situation, we may assign the variety of rice to be grown in different parts of the field on the basis of some random sampling technique i.e., we may apply randomization principle and protect ourselves against the effects of the extraneous factors (soil fertility differences in the given case). As such, through the application of the principle of randomization, we can have a better estimate of the experimental error.
3. Principle of Local Control
The Principle of Local Control is another important principle of experimental designs. Under it the extraneous factor, the known source of variability, is made to vary deliberately over as wide a range as necessary and this needs to be done in such a way that the variability it causes can be measured and hence eliminated from the experimental error. This means that we should plan the experiment in a manner that we can perform a two-way analysis of variance, in which the total variability of the data is divided into three components attributed to treatments (varieties of rice in our case), the extraneous factor (soil fertility in our case) and experimental error.* In other words, according to the principle of local control, we first divide the field into several homogeneous parts, known as blocks, and then each such block is divided into parts equal to the number of treatments. Then the treatments are randomly assigned to these parts of a block. Dividing the field into several homogenous parts is known as ‘blocking’. In general, blocks are the levels at which we hold an extraneous factor fixed, so that we can measure its contribution to the total variability of the data by means of a two-way analysis of variance. In brief, through the principle of local control we can eliminate the variability due to extraneous factor(s) from the experimental error.
Experimental Research Designs
Experimental Research design refers to the framework or structure of an experiment and as such there are several experimental designs. We can classify experimental designs into two broad categories:
1. Informal experimental designs:
i. Before-and-after without control design.
ii. After-only with control design.
iii. Before-and-after with control design.
2. Formal experimental designs:
i. Completely randomized design (C.R. Design).
ii. Randomized block design (R.B. Design).
iii. Latin square design (L.S. Design).
iv. Factorial designs.
1. Informal Experimental research design
Informal experimental designs are those designs that normally use a less sophisticated form of analysis based on differences in magnitudes.
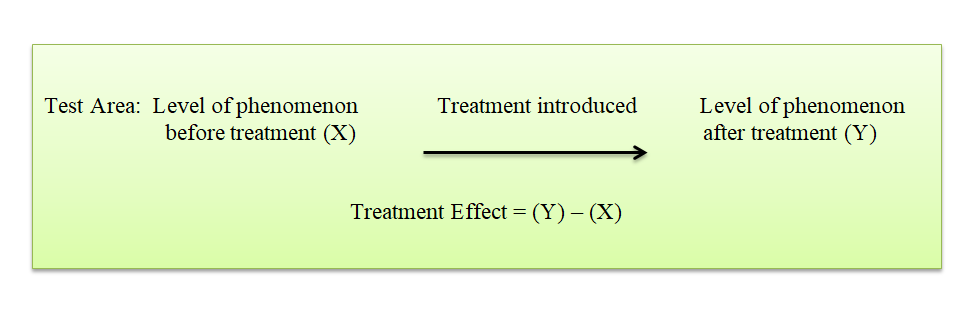
i. Before-and-after without control design:
In such a design a single test group or area is selected and the dependent variable is measured before the introduction of the treatment. The treatment is then introduced and the dependent variable is measured again after the treatment has been introduced. The effect of the treatment would be equal to the level of the phenomenon after the treatment minus the level of the phenomenon before the treatment. The main difficulty of such a design is that with the passage of time considerable extraneous variations may be there in its treatment effect.
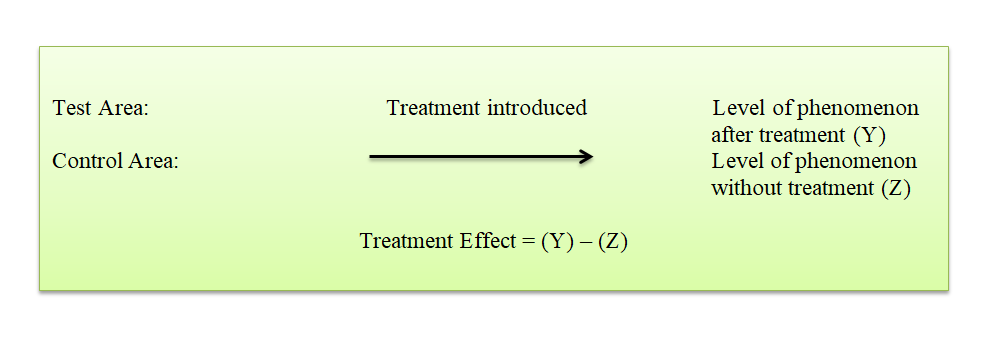
ii. After-only with control design :
In this design two groups or areas (test area and control area) are selected and the treatment is introduced into the test area only. The dependent variable is then measured in both the areas at the same time. Treatment impact is assessed by subtracting the value of the dependent variable in the control area from its value in the test area.
The basic assumption in such a design is that the two areas are identical with respect to their behaviour towards the phenomenon considered. If this assumption is not true, there is the possibility of extraneous variation entering into the treatment effect. However, data can be collected in such a design without the introduction of problems with the passage of time. In this respect the design is superior to before-and-after without control design.
iii. Before-and-after with control design: In this design two areas are selected and the dependent variable is measured in both the areas for an identical time-period before the treatment. The treatment is then introduced into the test area only, and the dependent variable is measured in both for an identical time-period after the introduction of the treatment. The treatment effect is determined by subtracting the change in the dependent variable in the control area from the change in the dependent variable in test area.
This design is superior to the above two designs for the simple reason that it avoids extraneous variation resulting both from the passage of time and from non-comparability of the test and control areas. But at times, due to lack of historical data, time or a comparable control area, we should prefer to select one of the first two informal designs stated above.

2. Formal Experiment Design
Formal experimental designs offer relatively more control and use precise statistical procedures for analysis.
i. Completely randomized design (C.R. design)
Involves only two principles viz., the principle of replication and the principle of randomization of experimental designs. It is the simplest possible design and its procedure of analysis is also easier. The essential characteristic of the design is that subjects are randomly assigned to experimental treatments (or vice-versa). For instance, if we have 10 subjects and if we wish to test 5 under treatment A and 5 under treatment B, the randomization process gives every possible group of 5 subjects selected from a set of 10 an equal opportunity of being assigned to treatment A and treatment B. One-way analysis of variance (or one-way ANOVA)* is used to analyse such a design. Even unequal replications can also work in this design. It provides maximum number of degrees of freedom to the error. Such a design is generally used when experimental areas happen to be homogeneous. Technically, when all the variations due to uncontrolled extraneous factors are included under the heading of chance variation, we refer to the design of experiment as C.R. design.
ii. Randomized block design (R.B. design)
It is an improvement over the C.R. design. In the R.B. design the principle of local control can be applied along with the other two principles of experimental designs. In the R.B. design, subjects are first divided into groups, known as blocks, such that within each group the subjects are relatively homogeneous in respect to some selected variable. The variable selected for grouping the subjects is one that is believed to be related to the measures to be obtained in respect of the dependent variable. The number of subjects in a given block would be equal to the number of treatments and one subject in each block would be randomly assigned to each treatment. In general, blocks are the levels at which we hold the extraneous factor fixed, so that its contribution to the total variability of data can be measured. The main feature of the R.B. design is that in this each treatment appears the same number of times in each block. The R.B. design is analysed by the two-way analysis of variance (two-way ANOVA)* technique.
Let us illustrate the R.B. design with the help of an example. Suppose four different forms of a standardised test in statistics were given to each of five students (selected one from each of the five I.Q. blocks) and following are the scores which they obtained. If each student separately randomized the order in which he or she took the four tests (by using random numbers or some similar device), we refer to the design of this experiment as a R.B. design. The purpose of this randomization is to take care of such possible extraneous factors (say as fatigue) or perhaps the experience gained from repeatedly taking the test.
| Very low I.Q. | Low I.Q. |
Average I.Q. |
High I.Q. |
Very high I.Q. | |||||||||||
| Student A |
Student B |
Student C |
Student D |
Student E |
|||||||||||
| Form 1 | 82 | 67 | 57 | 71 | 73 | ||||||||||
| Form 2 | 90 | 68 | 54 | 70 | 81 | ||||||||||
| Form 3 | 86 | 73 | 51 | 69 | 84 | ||||||||||
| Form 4 | 93 | 77 | 60 | 65 | 71 | ||||||||||
iii. Latin Square design (L.S. Design)
A Latin square is one of the experimental designs which has a balanced two-way classification scheme. Since a Latin square is a balanced arrangement of data, it must have the same number of columns and rows. A Latin square of , say, k order, must possess k rows and k columns in such a way that each symbol or letters occurs just once in each row and in each column. As these symbols or letter can be arranged in a number of ways, several different Latin squares can be constructed.
For instances, an experiment has to be made through which the effects of five different varieties of fertilizers on the yield of a certain crop, say wheat, it to be judged. In such a case the varying fertility of the soil in different blocks in which the experiment has to be performed must be taken into consideration; otherwise the results obtained may not be very dependable because the output happens to be the effect not only of fertilizers, but it may also be the effect of fertility of soil. Similarly, there may be impact of varying seeds on the yield. To overcome such difficulties, the L.S. design is used when there are two major extraneous factors such as the varying soil fertility and varying seeds.
The Latin-square design is one wherein each fertilizer, in our example, appears five times but is used only once in each row and in each column of the design. In other words, the treatments in a L.S. design are so allocated among the plots that no treatment occurs more than once in any one row or any one column. The two blocking factors may be represented through rows and columns (one through rows and the other through columns). The following is a diagrammatic form of such a design in respect of, say, five types of fertilizers, viz., A, B, C, D and E and the two blocking factor viz., the varying soil fertility and the varying seeds:
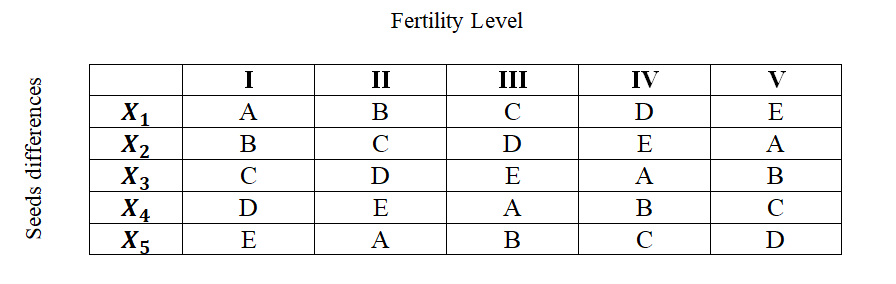
The above diagram clearly shows that in a L.S. design the field is divided into as many blocks as there are varieties of fertilizers and then each block is again divided into as many parts as there are varieties of fertilizers in such a way that each of the fertilizer variety is used in each of the block (whether column-wise or row-wise) only once. The analysis of the L.S. design is very similar to the two-way ANOVA technique.
The merit of this experimental design is that it enables differences in fertility gradients in the field to be eliminated in comparison to the effects of different varieties of fertilizers on the yield of the crop. But this design suffers from one limitation, and it is that although each row and each column represents equally all fertilizer varieties, there may be considerable difference in the row and column means both up and across the field. This, in other words, means that in L.S. design we must assume that there is no interaction between treatments and blocking factors. This defect can, however, be removed by taking the means of rows and columns equal to the field mean by adjusting the results. Another limitation of this design is that it requires number of rows, columns and treatments to be equal. This reduces the utility of this design. In case of (2 x 2) L.S. design, there are no degrees of freedom available for the mean square error and hence the design cannot be used. If treatments are 10 or more, than each row and each column will be larger in size so that rows and columns may not be homogeneous. This may make the application of the principle of local control ineffective. Therefore, L.S. design of orders (5 x 5) to (9 x 9) are generally used.
iv. Factorial design
Factorial designs are by far the most often used multivariate technique of research studies, specially pertaining to social and behavioral sciences. They are specially important in several economic and scial phenomenon where usually a large number of factors affect a particular problem. Factorial designs can be of two types:
a) Simple factorial designs
In case of simple factorial designs, we consider the effects of varying two factors on the dependent variable, but when an experiment is done with more than two factors, we use complex factorial designs. Simple factorial design is also termed as a ‘two-factor-factorial design’, whereas complex factorial design is known as ‘multifactor-factorial design.’ Simple factorial design may either be a 2 x 2 or 3 x 4 or 5 x 3 type.
b) Complex factorial designs
A design which considers more than three variables simultaneously is called Complex factorial designs. In case of three factors with one experimental variable having two treatments and two control variables, each one of which having two levels, the design used will be termed 2 x 2 x 2 complex factorial design which will contain a total of eight cells . It may, however, be remembered that the complex factorial design need not necessarily be of 2 x 2 x 2 type design, but can be generalised to any number and combination of experimental and control independent variables. Of course, the greater the number of independent variables included in a complex factorial design, the higher the order of the interaction analysis possible. But the overall task goes on becoming more and more complicated with the inclusion of more and more independent variables in our design.
Factorial designs are used mainly because of the two advantages.
- They provide equivalent accuracy (as happens in the case of experiments with only one factor) with less labour and as such are a source of economy. Using factorial designs, we can determine the main effects of two (in simple factorial design) or more (in case of complex factorial design) factors (or variables) in one single experiment.
- They permit various other comparisons of interest. For example, they give information about such effects which cannot be obtained by treating one single factor at a time. The determination of interaction effects is possible in case of factorial designs.
3. Descriptive Research
As the name suggests, descriptive research is undertaken to describe the situation, community, phenomenon, outcome or programme. The main goal of this type of research is to describe the data and characteristics about what is being studied. Descriptive research designs help provide answers to the questions of who, what, when, where and how associated with a particular research problem; a descriptive study cannot conclusively ascertain answers to why. Descriptive research is used to obtain information concerning the current status of the phenomenon and to describe “what exists” with respect to variables or conditions in a situation.
Descriptive research is usually a fact finding approach generalizing a cross-sectional study of the present situation. For example, a study on problems of Industrial Relations in India with an inter-disciplinary approach. The annual census carried out by the Government of India is an example of descriptive research. It is classified under conclusive research. The findings of descriptive studies are largely of a diagnostic nature, i.e. the studies indicate the existing symptoms of a particular situation without establishing the causality of the relationship.
Types of Descriptive Research
a) Case Study
b) Observation
c) Surveys
a) Case Study
Case study research involves an in-depth study of an individual or group of indviduals. It is used to analyze a particular trend, event or condition. Here the researcher is supposed to narrow down a general subject of research and concentrate on a strategically chosen ‘case’ instead of randomly chosen participants. Case studies are a great way to develop a hypothesis. Case studies often lead to testable hypotheses and allow us to study rare phenomena. Case studies should not be used to determine cause and effect, and they have limited use for making accurate predictions.
b) Observation
This method of descriptive study is characterized by active participation of the researcher in the event of phenomenon that is being studied. The data collected through observation is descriptive and is in the form of notes, assimilated over a long duration, or recordings of behavior and communication of the group members. An essential factor to be remembered is that the researcher must not influence the behavior of the participants in any way.
c) Surveys
In survey method research, participants answer questions administered through interviews or questionnaires. After participants answer the questions, researchers describe the responses given. In order for the survey to be both reliable and valid it is important that the questions are constructed properly. Questions should be written so they are clear and easy to comprehend.
Advantages of Descriptive Research
- Effective to analyse non-quantified topics and issues
- The possibility to observe the phenomenon in a completely natural and unchanged natural environment
- The opportunity to integrate the qualitative and quantitative methods of data collection
- Less time-consuming than quantitative experiments
Disadvantages of Descriptive Research
- Descriptive studies cannot test or verify the research problem statistically
- Research results may reflect certain level of bias due to the absence of statistical tests
- The majority of descriptive studies are not ‘repeatable’ due to their observational nature
- Descriptive studies are not helpful in identifying cause behind described phenomenon
4. Historical Research
Historical research is that which utilizes historical sources like documents, remains, etc. to study events or ideas of the past, including the philosophy of persons and groups at any remote point of time. The purpose of historical research design is to collect, verify and synthesize evidence from the past to establish facts that defend or refute a hypothesis. It uses secondary sources and a variety of primary documentary evidence, such as diaries, official records, reports, archives, and non-textual information (maps, pictures, audio and visual recordings).
Features/Characteristics
i. It depends upon data observed by others rather than by the investigator.
ii. Much research claiming to be historical is an undisciplined collection inappropriate, unreliable or biased information.
iii. While historical is similar to the reviews of the literature which precede other forms of research, the historical approach is more exhaustive, seeking out information from a larger array of sources.
Advantages:
- The main advantage of historical research is that is permits theinvestigation of topics that could be studied in no other way.
- It is the only research method that can study evidence from the past.
- The historical method is well suited for trend analysis
Disadvantages:
- Cannot control for threats to internal validity
- Limitations are imposed due to the content analysis
- Researchers cannot ensure representation of the sample.
- Bias in interpreting historical sources.
- Interpreting sources is very time consuming.
- Sources of historical materials may be problematic
- Lack of control over external variables
4. Qualitative and Quantitative and Qualitative methods.
Qualitative Research
Qualitative research is concerned with qualitative phenomenon, i.e. phenomenon relating to or involving quality or kind, For example, Motivational Research where are interested in investigating the reasons for human behaviour (i.e. why people think or do certain things). This type of research aims at discovering the underlying motives and desires, using in depth interviews for the purpose.Another example is Attitude or opinion research where research is designed to find out how people feel or what they think about a particular subject orinstitution.
According to Strauss and Corbin
Qualitative research is any type of research that produces findings nor arrived at by statistical procedures or other means of quantification”.
Sources of Qualitative Research Data
- Focus group
- Observations
- In-depth interviews
- Document review
- Focus group
The focus group technique allows you to bring a selected number of people together to discuss the issues that your investigation centers on. For example, a company is about to introduce a new product into a particular market and is not sure about how consumers will respond to the product and marketing strategies, the company may ask you to conduct a focus group study to gain insights into potential consumer perception. To do this you will select about twelve individuals who do not know each other. Your selection should be guided by some specific criteria (e.g. age, income, levels of education) that are of particular interest to the company. You should then arrange with them to meet and discuss various aspects of the product- quality, colour, size, price range, and typical shops in which such a product will be expected to be sold. This session typically lasts for one to two hours. Focus groups combine elements of both interviewing and participant observation. The focus group session is, indeed, an interview—not a discussion group, problem-solving session, or decision-making group
- Observations
When you are dealing with subject that people are likely to feel uncomfortable or unwilling to discuss you may want to use observation technique. You may use your observation simply to describe the phenomenon or to make inferences about what you observe, or even make personal assessments.
- Interviews
In‐depth interviews are a useful qualitative data collection technique that can be used for a variety of purposes, including needs assessment, program refinement, issue identification, and strategic planning. In‐depth interviews are most appropriate for situations in which you want to ask open‐ended questions that elicit depth of information from relatively few people (as opposed to surveys, which tend to be more quantitative and are conducted with larger numbers of people)
- Document review
This method involves the use of previously existing and reliable documents and other sources of information as a source of data to be used in a new research or investigation.
Quantitative research
Quantitative research is based on measurement of quantity or amount. It is applicable to phenomenon that can be expressed in terms of quantity.
Sources of Quantitative Data
1. Quantitative Surveys
Unlike the open-ended questions asked in qualitative questionnaires, quantitative paper surveys pose closed questions, with the answer options provided. The respondents will only have to choose their answer among the choices provided on the questionnaire.
2. Questionnaires
Questionnaires often make use of checklist and rating scales. These devices help simplify and quantify people’s behaviors and attitudes. A checklist is a list of behaviors, characteristics, or other entities the researcher is looking for. Either the researcher or survey participant simply checks whether each item on the list is observed, present or true or vice versa. A rating scale is 6 more useful when a behavior needs to be evaluated on a continuum. They are also known as Likert scales.
3. Interviews
Personal one-on-one interviews may also be used for gathering quantitative data. In collecting quantitative data, the interview is more structured than when gathering qualitative data, comprised of a prepared set of standard questions.
These interviews can take the following forms:
- Face-to-face interviews: Much like when conducting interviews to gather qualitative data, this can also yield quantitative data when standard questions are asked.
- Telephone and/or online, web-based interviews. Conducting interviews over the telephone is no longer a new concept. Rapidly rising to take the place of telephone interviews is the video interview via internet connection and web-based applications, such as Skype
- Computer-assisted interviews. This is called CAPI, or Computer-Assisted Personal Interviewing where, in a face-to-face interview, the data obtained from the interviewee will be entered directly into a database through the use of a computer.
4. Experiments
These methods involve manipulation of an independent variable, while maintaining varying degrees of control over other variables, most likely the dependent ones. Usually, this is employed to obtain data that will be used later on for analysis of relationships and correlations.
Quantitative researches often make use of experiments to gather data, and the types of experiments are:
- Laboratory experiments. This is your typical scientific experiment setup, taking place within a confined, closed and controlled environment (the laboratory), with the data collector being able to have strict control over all the variables. This level of control also implies that he can fully and deliberately manipulate the independent variable.
- Field experiments. This takes place in a natural environment, “on field” where, although the data collector may not be in full control of the variables, he is still able to do so up to a certain extent. Manipulation is still possible, although not as deliberate as in a laboratory setting.
- Natural experiments. This time, the data collector has no control over the independent variable whatsoever, which means it cannot be manipulated. Therefore, what can only be done is to gather data by letting the independent variable occur naturally, and observe its effects.
Difference between qualitative and quantitative research
| Qualitative Research | Quantitative Research | |
| 1. | Inductive or “bottom up” . The researcher generates new hypothesis and grounded theory from data collected during work. | Deductive or “top-down”. The researcher tests hypothesis and theory with data. |
| 2. | It is subjective, personal and socially constructed. | Objective |
| 3. | Search for patterns, themes and holistic features. | Identify statistical relationships. |
| 4. | Nature of data is words, image, categories. | Variables |
| 5. | The design is exploratory or descriptive, loosely structured and open to interpretation and presumptions. | The design is structured and has a measurable set of variables with a presumption about testing them. |
| 6. | Only a small sample is manageable as the information required needs to be extracted by a flexible and sometimes lengthy procedure. | Large representative samples can be measured and the data collected can be based upon a shorter time span with a larger number. |
| 7. | The data collection is in-depth and collected through a more interactive and unstructured approach. | The data collected is formatted and structured. |
| 5. | Interpretation of data is textual and usually non-statistical. | Interpretation of data entails various level of statistical testing. |
| 6. | The initial and ultimate objective is to explain the findings from more structured sources. | The findings must be conclusive and demonstrate clear indications of the decisive action and generalizations. |